 Euan Mearns and Didier Sornette are still writing up the results of the Energy Matters “Energy Game” for publication and have asked me to investigate the applicability of concentrated solar power (aka solar thermal) generation in Central Europe as part of that investigation. I have already published two posts on CSP, but these were written some time ago, so it’s time for an update. The results of the update confirm my previous conclusions that CSP is not a viable option for Central Europe because of its high capital cost, its extreme seasonal variation in output and its inability to generate any power at all on many cloudy winter days.
I begin this post by summarizing the key findings of the two previous studies. The update will come later:
A review of concentrated solar power in Spain, December 2, 2015:
Spain is one of the two places where I have comparative grid data for PV and CSP solar, The other is the Southwest US, which will be discussed in the next section. Spain is not in Central Europe, but CSP resources there will be superior to those found in Central Europe because of Spain’s lower latitude and more abundant sunshine.
The December 2015 post analyzed 10-minute data from Red Eléctrica de España (REE), the Spanish grid operator, for the months of June 2015 and November 2015, which at the time was a close to a winter month as I could get. Looking back through it, however, I find that Figures 1 and 2 did not properly illustrate the differences between PV and CSP because they plotted generation, which is dependent on installed capacity, rather than capacity factor. Figure 1 of this post, which compares daily PV and CSP capacity factors over a longer period based on later REE data, rectifies this omission:
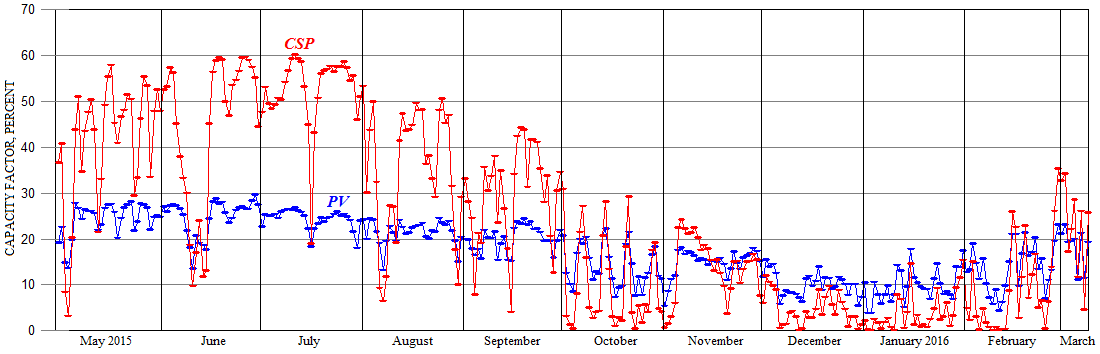
Figure 1: Daily average PV and CSP capacity factors, Spain, May 2015 through March 2016 (installed capacities are 4,700 MW of PV and 2,300 MW of CSP)
Mean capacity factors over the period shown are 17.8% for PV and 24.7% for CSP – not that large a difference. The main contrast is in seasonal range, with PV capacity factors averaging around 25% in the summer and 10% in the winter while CSP capacity factors approach 60% in the summer but fall to zero or near-zero on many winter days. This contrast occurs because PV works to some extent even on cloudy days while CSP requires direct sunlight, which Spain seems to receive little of in the winter. (Note also the large decreases in summer CSP generation when the sun disappears behind clouds for up to a week.)
Clearly a technology that supplies most of its energy to Central Europe in midsummer, when Central Europe demand is low, and little or none in midwinter, when demand is high, is of limited use in Central Europe.
The claimed advantage of CSP over PV is that it offers the option to store energy in the form of heat (usually molten salt). However, only about 1,000MW of Spain’s 2,300MW of CSP has storage capacity, and with an average storage duration of around 7.5 hours the total storage capacity at these plants is approximately 7,700 MWh. but over 1,000 GWh of storage – several hundred times as much – would be needed to convert the intermittent CSP generation shown in Figure 1 into 24/365 dispatchable energy. And Spain’s 7,700 MWh of CSP storage was not sufficient even to keep the electricity coming through the night. Figure 2, reproduced from the 2015 post, compares my best estimates of CSP energy sent directly to the grid from a) daytime generation and b) nighttime storage with Spain’s total electricity demand over selected periods in June and November:

Figure 2: Daytime and nighttime stored generation delivered to grid, 10-minute REE data, Spain, July and November 2015. (The “flat spots” during the late evening and early morning hours appear to be default values. Actual generation from storage during these intervals was probably zero.)
No effort was made to match output to demand basically because Spain’s CSP producers had no financial incentive to do so (so far as I know no premiums were paid for stored power). As a result only 19% of the CSP electricity delivered to the grid in June came from storage, and while I have no estimate for all of 2015 I would guess that 10% would be a reasonable assumption.
Other takeaways from the 2015 post were:
- CSP capital costs per installed kilowatt are approximately three times higher than PV capital costs
- CSP plants are claimed to have higher capacity factors than PV plants because capacity factors are calculated based on the capacity of the turbine, not the capacity of the mirror array. When capacity factors are calculated based on the capacity of the mirror/solar array CSP plants are actually about a third less efficient than PV plants.
- None of the plants would have been built without generous subsidies from the Spanish government.
Concentrated solar power in the US, a performance review, April 24, 2017:
The US is of course not part of Central Europe, but plans are in hand to import solar power into Central Europe from CSP plants in the Northern Sahara, and the existing CSP plants in the Southwest US deserts are analogs of a Northern Sahara plant in terms of climate and latitude.
Figure 3 shows monthly average production, again expressed as capacity factors, for the four CSP plants in Arizona and Southern California that were operating during 2015 and 2016. The combined capacity of these plants is 1,142 MW, but only the Solana plant has storage (reported to be 1,680 MWh, sufficient for 6.7 hours of operation at the plant’s 250 MW rated capacity, but no details are available on performance):
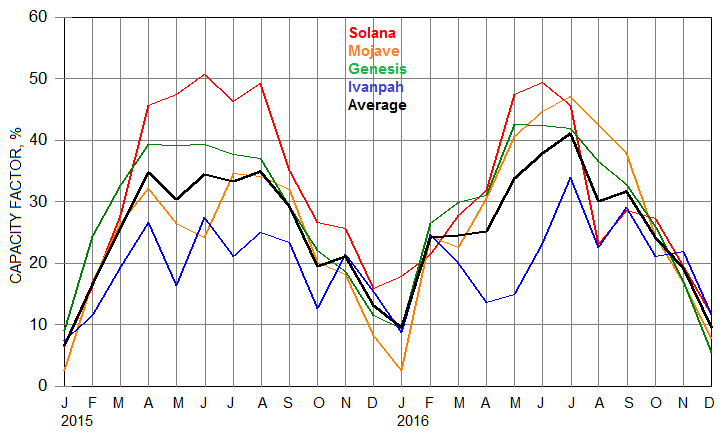
Figure 3: Monthly capacity factors at four Southwest US CSP plants, 2015 and 2016. Reproduced from Figure 2 of the April 2017 post
The only good thing about these results is that the sun seems to shine more brightly during the winter months in the Southwest US that it does in Spain, resulting in a less extreme seasonal range. The average capacity factor for all four plants, however, is only 25.4%, no higher than the capacity factors achieved at conventional utility-scale PV plants in the Southwest US. According to the EIA data reviewed in Solar capacity factors in the US, which yielded values of 28.7% in California and 27.0% in Arizona, it is in fact lower.
All four plants have performed below expectations, partly because of weather-related events (Solana was shut down by damage caused by high winds) and partly because of operational problems (Ivanpah unit 2 caught fire because of misaligned mirrors). Another problem – and one that also affects Spain’s CSP plants – is that CSP plants commonly have to be jump-started in the mornings by natural gas and sometimes reinforced by natural gas during cloudy daytime periods in order to keep running. I have no numbers on what fraction of total global CSP output is generated by natural gas, but Spain allows up to 15% of its CSP generation to come from natural gas, and almost a quarter of Ivanpah’s total 2016 generation was gas-fired. (California increased Ivanpah’s gas-generation threshold to keep the plant in business.)
Updated CSP data for Spain
I did this work partly to see whether anything had changed since 2015 but in particular to make sure that Spain’s CSP plants in 2015 were not still suffering from the teething troubles that have plagued US CSP plants. (They should not be. The last of them was installed in 2013 and CSP capacity has remained stable at 2,300MW since. Spain’s PV capacity has increased marginally from ~4,700 to ~5,000 MW over this period, according to IRENA.)
Figure 4 compares REE ten-minute grid data for the months of July 2017 (midsummer) and January 2018 (midwinter). Things have not changed much since 2015. PV generation still fall short of CSP generation in July but exceeds it in January, and there are again several days in January when CSP generation is close to zero. Average capacity factors are 47.5% in July and 6.1% in January for CSP and 22.3% in July and 11.2% in January for PV. The means of the two estimates are 26.8% for CSP and 16.8% for PV, comparable to the 24.7% and 17.8% values 0ntained from the 2015-16 data discussed earlier:

Figure 4: Ten-minute average PV and CSP capacity factors, Spain, January 2018 and July 2017. Installed capacities are 5,000 MW of PV and 2,300 MW of CSP, representing about half of the world’s total installed CSP capacity.
Figure 5 plots daytime and nighttime stored generation delivered to the grid in July 2017. Some 16% of it came from storage compared to 19% in June 2015. The largest amount delivered from storage in a single day was 6.6 MWh on the night of July 2/3, indicating that the ~7.7MWh of available CSP storage is being used at close to its full capacity when sufficient heat is left over after the sun sets. As illustrated on Figure 5, however, Spain’s CSP plants do not supply electricity all through the night even at low output levels – production always falls off before the sun rises the next morning. On the night of July 17/18 there was effectively no production from storage at all:

Figure 5: Daytime and nighttime stored generation delivered to grid, 10-minute REE data, Spain, July 2017
Finally, according to NREL 2017 data a CSP plant with storage is four times as expensive as a utility-scale PV plant ($8,000 vs. $2,000/kW installed).
Conclusions:
The purpose of this post was to investigate the applicability of concentrated solar power generation in Central Europe. The conclusion is not hard to reach. Utility-scale solar PV is of limited value in Central Europe because of its poor winter production and high seasonal range, which as discussed in previous posts requires prohibitive amounts of storage to match PV generation at any scale to demand over the course of a year. CSP, which produces even less electricity than PV in the winter (often none at all), has even larger seasonal ranges than PV and costs three or four times as much per installed kilowatt, can therefore be classified as inapplicable to Central Europe, and based on the results presented here arguably to most other parts of the world as well.
