From Energy Matters: The causes of the differences between European and US residential electricity rates
 The price of residential electricity has risen in lockstep with growth in renewable capacity in Europe but not in the US, and because of this European residential electricity rates are now roughly twice US rates. The reasons for the difference are a) that renewables surcharges are added to residential electricity bills in Europe but not in the US and b) that residential electricity bills in Europe have increased roughly in proportion to the amount of money spent on renewables growth. Residential rates in US states are set by state Public Utility Commissions that are legally obliged to set prices at levels that are fair to both consumers and providers. As a result the European bill payer pays for new wind, solar etc. while US renewables expenditures are offset by adjustments to the federal budget that are not itemized but which ultimately get paid by the US taxpayer.
A note before proceeding. Electricity bills in Europe typically contain renewable energy levies, fees, surcharges etc. that are paid to the electricity provider. How much of this ends up in the hands of the government is unknown, so in this post I classify these added costs as “charges” rather than “taxes”.
We begin with a map of the US “Lower 48” showing average state retail electricity rates in US cents/kWh in 2016. The map is dominated by blue colors, i.e. less than 15c/kWh. The data are from the US Energy Information Administration:
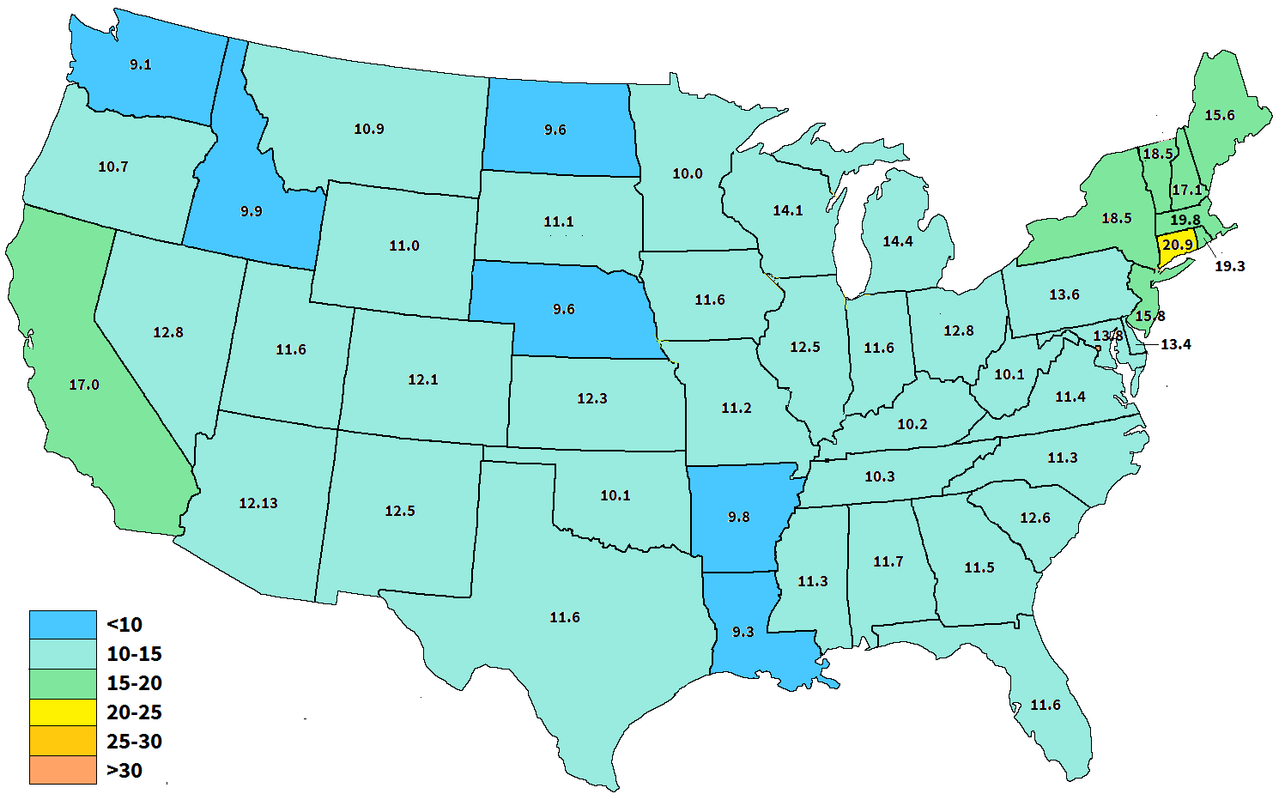
Figure 1: Average retail electricity prices in the US Lower 48 in 2016, US cents/kWh
And follow up with a map that covers roughly the same area showing average retail electricity rates by country in Europe in 2016. The color coding is the same, and rates are converted into US cents/kWh using the exchange rate at the time of converion (1 euro = 1.22 USD) so that they can be compared directly with the Figure 1 results. The data are from Eurostat.
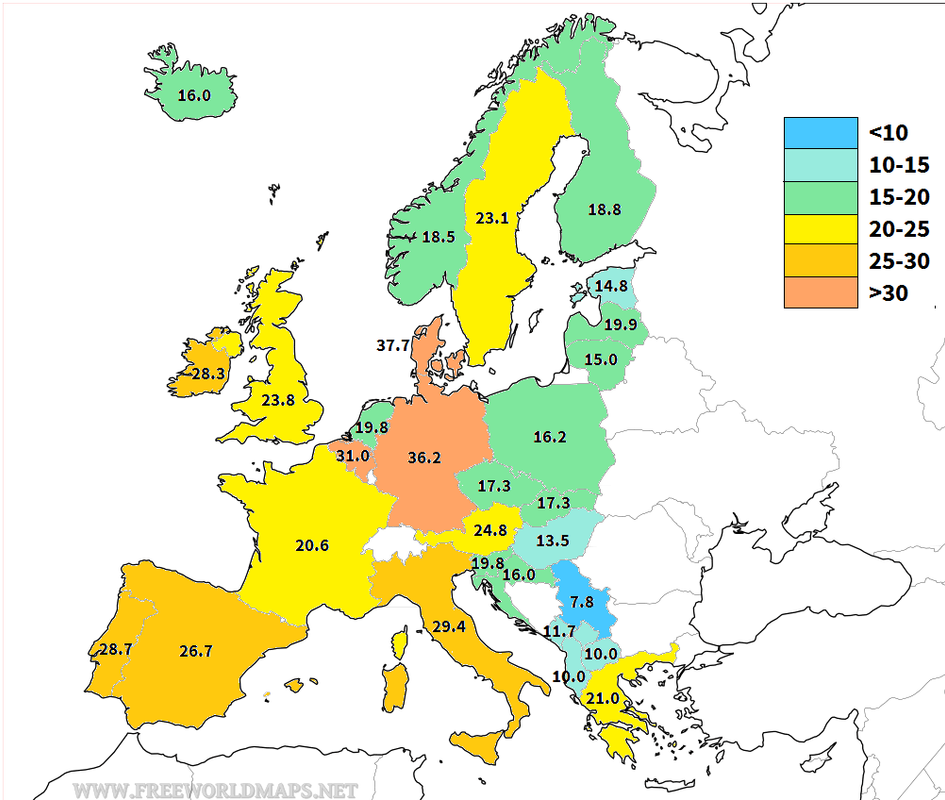
Figure 2: Average retail electricity prices in Europe in 2016, US cents/kWh
The dominant blues of Figure 1 are seen only in the Balkans, Hungary and Estonia. Western Europe is now plastered with yellows and oranges. Residential electricity rates are clearly much higher in Europe than in the US – more that twice as high in fact. In 2016 they averaged 26.6 c/kWh in the Euro area and 12.7 c/kWh in the US.
To complete the picture Figure 3 shows the percentage of “new” renewables (wind, solar, biomass etc. but excluding hydro) in the US, the EU and selected European countries. In 2016 renewables contributed 18.5% of EU generation but only 8.8% of US generation, indicating that renewables development to date will have cost the EU proportionately about twice as much as the US. As discussed later, however, this is not the cause of the differences in residential electricity rates.
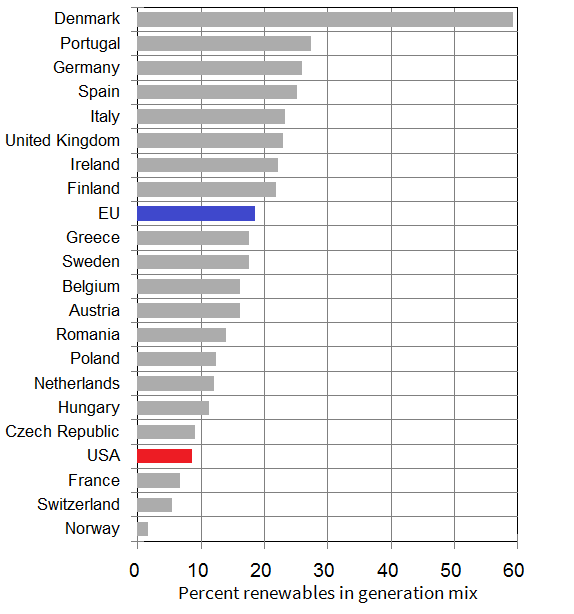
Figure 3: Percent “new” renewables (wind, solar, biomass etc. but excluding hydro) in European and US generation mixes. Data from BP.
Residential electricity rates in Europe
Why are rates so much higher in Europe? Euan Mearns’ compelling graphic, first published in his 2015 green mythology and the high price of European electricity post, shows that residential electricity rates in Europe are closely correlated (r2=0.85) with installed wind + solar capacity per capita, leaving no doubt that the percentage of renewables in a country’s energy mix is a key factor when it comes to setting residential electricity rates:

Figure 4: Residential electricity price vs. Installed wind and solar capacity per capita by country, Europe. Graphic from Euan Mearn’s post.
The second question is why does such a correlation exist? An exhaustive review of data from all the countries shown in Figure 3 is not possible, but this graphic from the German Energy Transition provides some insights. The ”items that more closely reflect (the) price tag for the Energiewende” add 43% (12.46 eurocents) to Germany’s residential rates. Note also that effectively all of the increase in Germany’s residential electricity rates between 2006 and 2013 was a result of Energiewende charges:
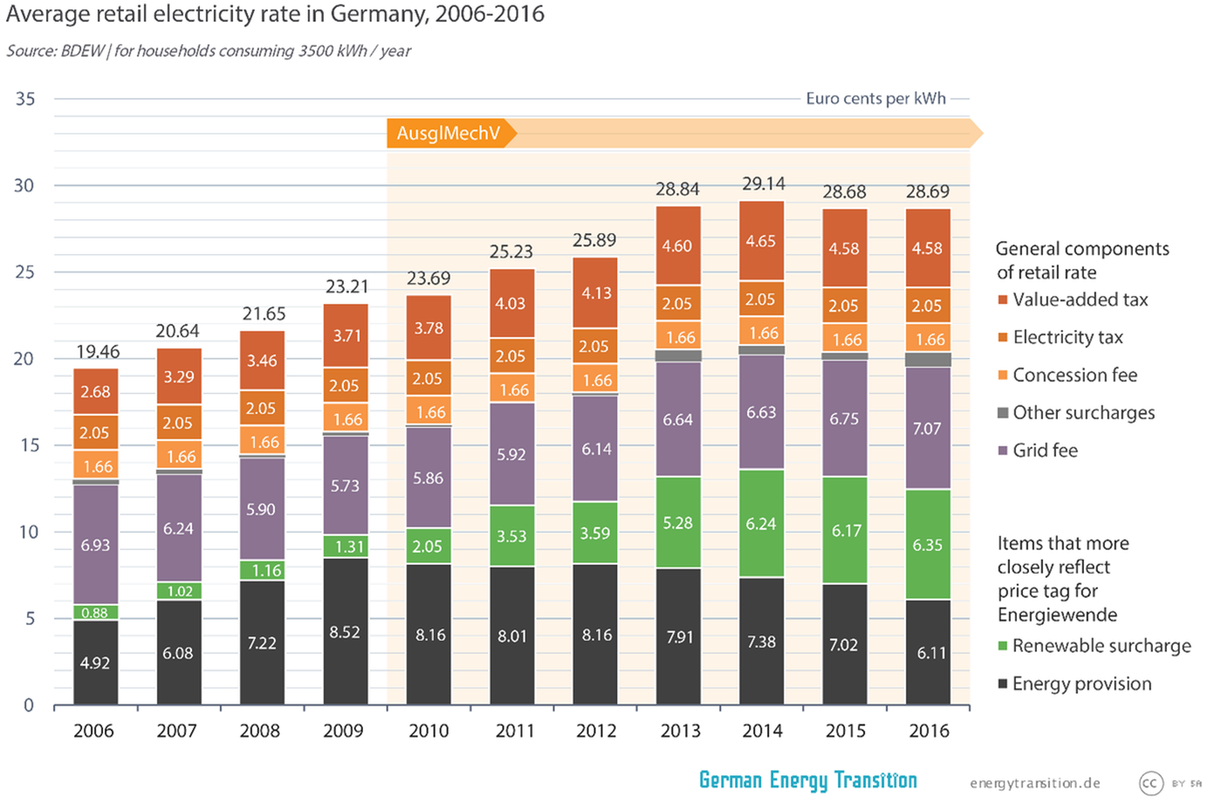
Figure 5: Items contributing to Germany’s retail electricity rate, 2006-2016
How much money is involved in the “items that more closely reflect (the) price tag for the Energiewende”? According to BP, Germany’s total electricity generation in 2016 was 648.4 TWh, according to Eurostat its residential consumption amounted to 19.6% of that, and according to Figure 5 Energiewende charges in 2016 were 12.46 eurocents/kWh. These numbers add up to €15.8 billion ($US19.3 billion) paid by residential electricity consumers in 2016 alone. Adding the data going back to 2006 assuming 20% residential consumption increases the total to €150 billion (~$US180 billion), and adding pre-2006 tax receipts could well raise the total to more than $US200 billion. Not exactly peanuts.
An interesting question here is whether these billions of euros/dollars cover the costs of the Energiewende? No one knows. According to this recent audit:
Based on the recent audit report by the Bundesrechnungshof, the total governmental costs of Energiewende are not entirely clear even for the leading Ministries and the delineation of the expenditure items corresponding to Energiewende is not conducted in a fully coherent manner ….
It’s nothing short of amazing that Germany, having staked its future on the success of its Energiewende, and having spent vast sums of money on it, doesn’t know how much it has spent.
Little data are available, or at least not readily available, for other European countries. The best data I was able to come up with are shown in Figure 6. There is a wide range of variation between countries in RES (renewable energy sources, complicated by the addition of combined heat & power) charges, with some listing no charges at all. According to the results these items also added only about 7 eurocents to Germany’s 2015 rate, barely more than half the 13.19 eurocents shown in Figure 5:
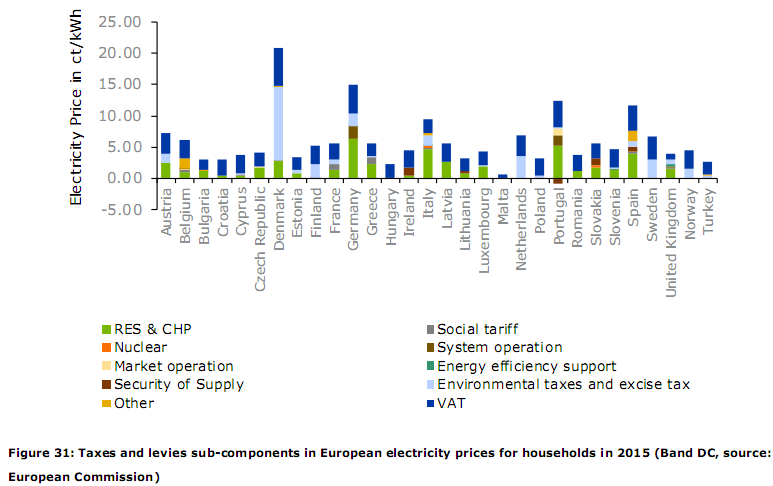
Figure 6: Taxes and levies in European residential electricity prices in 2015 by country. Data from the EC Prices and costs of EU energy final report.
There is a reasonable supposition here that the Figure 6 data are not reliable, so I went to a shotgun approach using XY-plots. One would expect a correlation between European residential electricity rates and added charges for renewables, but is there a correlation between these added charges and the percentage of renewables in a country’s energy mix? To check this out I constructed an XY plot of percentage renewables (from Figure 4) against residential electricity charges assuming that the charges would be proportional to the percentage of renewables in the country’s generation mix. The results are shown in the two graphics in Figure 7:

Figure 7: Percent renewables in energy mix vs. percent charges on residential electricity, Europe. Data from Euan Mearns and Eurostat
The first graphic contains two outliers – Ireland and Spain. I have assumed that these are a result of accounting procedures in these two countries being different to those elsewhere, so I took the liberty of deleting them in the second graphic. The R2 value increases from 0.42 to 0.76, indicating that the charges levied on residential electricity in the 18 countries that remain are quite strongly correlated with level of renewables development in that country.
Now we shift attention from Europe to the United States of America, which is a different ball game.
Residential electricity rates in the US
Figure 8 reproduces Figure 1 for reference:
Figure 8: Average retail electricity prices in the US Lower 48 in 2016, US cents/kW (reproduction of Figure 1)
As noted earlier the map divides itself into two – dominant blues over most of the lower 48, and greens plus one yellow in the Northeast US states (New Jersey, New York, Connecticut, Rhode Island, Massachusetts, New Hampshire, Vermont and Maine) plus a green in, inevitably, California.
The question here is whether these colors represent two statistically-different populations. I looked into this first by constructing an XY plot of the percentage of coal in each state’s generation mix versus its retail electricity rate and came up with the results shown in Figure 9:

Figure 9: Percent coal in generation mix vs. retail electricity rate by state, US lower 48, 2016. Data from EIA
The nine green and yellow states are highlighted in red. They are clearly an “outlier” population. I confirmed this by calculating the Smith-Satterthwaite t-statistic for the two populations defined by the red and black points. A t-stat value of two or more is considered indicative of two populations that are significantly different. I obtained a value of 10.7. (The reasons for this difference are discussed briefly in the Appendix at the end.)
Based on these results I discarded the data from the nine outlier states as non-representative and continued with the remaining 39. This yielded the results shown in Figure 10. There is now no relationship between the percentage of coal in the generation mix and retail electricity prices (R2 = 0.00):

Figure 10: Figure 9 with the nine outlier states deleted
There is also little or no relationship for the other main sources of dispatchable generation – gas, nuclear and hydro:

Figure 11: Percent gas, nuclear and hydro in generation mix vs. retail electricity rate by state, 39 of US lower 48 states, 2016
The trend lines show residential rates increasing slightly with increasing gas and nuclear penetration, but R2 values are very low (0.03 for gas and 0.12 for nuclear). As would be expected the hydro trend line shows rates decreasing with increasing hydro penetration, but again with an R2 value of only 0.10. (The five states with more than 30% hydro that generate this trend are, from left to right, Montana, South Dakota, Oregon, Idaho and Washington).
There is also no significant relationship for “new” renewables (wind, solar, biomass etc.) State residential electricity rates remain substantially the same regardless of the percentage of renewables in the state generation mix:

Figure 12: Percent renewables (wind, solar, biomass etc.) in generation mix vs. retail electricity rate by state, 39 of US lower 48 states, 2016
The bottom line seems to be that state generation mixes in the US have little if any impact on residential electricity prices.
What are the reasons for this? One might be that the generation data I use does not account for interstate transfers (I have no consumption data). Another is the impact of spot pricing market mechanisms that may tend to average prices out over large areas with diverse generation mixes, although I’m not sure about that either. Yet another is competition between states to attract new business, which in the case of energy-intensive businesses such as metal refineries and data processing centers is influenced by electricity prices.
The key determinant, however, is how US state residential electricity rates are established. In most states this done by Public Utility Commissions, or their equivalent, whose commissioners are usually elected by popular vote and therefore disinclined to raise electricity rates any more than they have to. They are aided by state regulations that commonly do not allow “large, sudden rate increases”. They are, however, required to set rates so that a state utility – which is treated as a monopoly – earns an adequate return on its investment. There’s even a formula for calculating it:
R = O + (V − D)r, where
R is the utility’s total revenue requirement or rate level. This is the total amount of money a regulator allows a utility to earn.
O is the utility’s operating expenses.
V is the gross value of the utility’s tangible and intangible property.
D is the utility’s accrued depreciation. Combined (V − D) constitute the utility’s rate base, also known as its capital investment.
r is the rate of return a utility is allowed to earn on its capital investment or on its rate base.
So far this system has served the US well. Consumers complain about their electricity bills and utilities complain that they are not earning the rate of return they are entitled to. A sign of balance, I think.
There is also a national regulator – the Federal Energy Regulatory Commission, which among other things Regulates the transmission and wholesale sales of electricity in interstate commerce. FERC’s regulation of interstate wholesale electricity sales is another reason why most US states have comparable residential rates, and may indeed be a major contributor.
Summing up:
This post addresses the question of the causes of the differences between European and US retail electricity rates. The answer is clear – the costs of Europe’s transition to renewables are borne at least in part by the consumer while in the US it is not, or at least not directly.
And when this cost burden is removed Europe’s residential electricity rates fall much more closely into line with US rates. Without the Energiewende charges shown in Figure 4 the residential electricity rate in Germany in 2016 would have been 16.23 eurocents/kWh, or about 19.8 US cents/kWh, the same as Massachusetts and less than Vermont. And if government-imposed taxes and fees indeed amount to 52 percent of the monthly power bill for German retail consumers, as Deutsche Welle claims, the rate drops to 13.78 eurocents/kWh, or about 16.8 US cents/kWh, on a par with California.
The US electricity consumer, however, does not get off scot-free. The money the US has spent on renewables in the form of subsidies and tax credits is offset by adjustments elsewhere in the federal budget that will ultimately be paid for in one form or another by the US taxpayer. But the taxpayer does not get to see the impacts in his or her electricity bill.
And US utilities don’t get off scot-free either. They are absorbing the costs of balancing ever-increasing levels of intermittent renewables generation without adequate compensation. But that’s another story.
Appendix: Generation mixes in the nine “outlier” states vs. the rest of the US
As discussed above, retail electricity rates are significantly higher in California and in eight contiguous states in the northeast US (New Jersey, New York, Connecticut, Massachusetts, Rhode Island, Vermont, New Hampshire and Maine) than they are in the other 39 states that make up the intervening “Lower 48”. What is the cause?
Table 1 compares the generation mixes in the nine states with generation mixes in the other 39 states and in the US as a whole. The largest difference is in coal (35% for the 39 states vs. only 1% for the nine), and the nine make up the shortfall by generating more from gas, nuclear, hydro and renewables (wind + solar + biomass etc.) Could this difference in generation mixes account for the differences in residential electricity rates? Based on the results of text Figures 10 and 11, which show no significant relationship between rates and the source of generation, it seems unlikely.

But the nine states generate a much larger fraction of their electricity from renewables (13.7% vs. 7.3%) than the other 39. Could this have had resulted in higher residential rates? Text Figure 12 says no. So does Figure A1 below, which plots the data for the nine states independently. The trend line in fact shows a tendency for rates to decrease rather than increase with increasing levels of renewables penetration:

Figure A1: Percent renewables (wind, solar, biomass etc.) in generation mix vs. retail electricity rate, nine “outlier” US states, 2016
I can only conclude that the differences occur because the people who live in the nine states tend to have a “greener” perspective than those who live in the other 39.
