 The best context for understanding decadal temperature changes comes from the world’s sea surface temperatures (SST), for several reasons:
- The ocean covers 71% of the globe and drives average temperatures;
- SSTs have a constant water content, (unlike air temperatures), so give a better reading of heat content variations;
- A major El Nino was the dominant climate feature in recent years.
HadSST is generally regarded as the best of the global SST data sets, and so the temperature story here comes from that source, the latest version being HadSST3. More on what distinguishes HadSST3 from other SST products at the end.
The Current Context
The chart below shows SST monthly anomalies as reported in HadSST3 starting in 2015 through July 2018.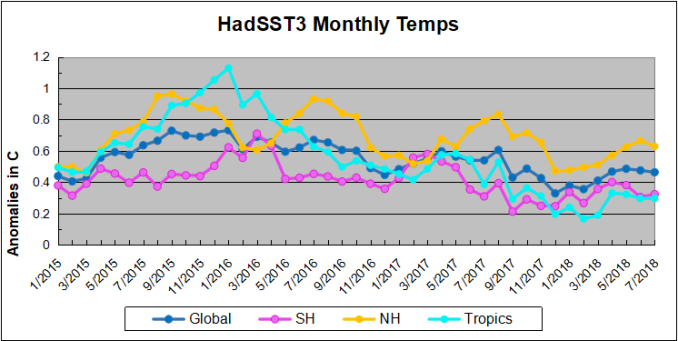 A global cooling pattern has persisted, seen clearly in the Tropics since its peak in 2016, joined by NH and SH dropping since last August. Upward bumps occurred last October…
View original post 1,250 more words
