By Paul Homewood
http://polarportal.dk/en/greenland/surface-conditions/
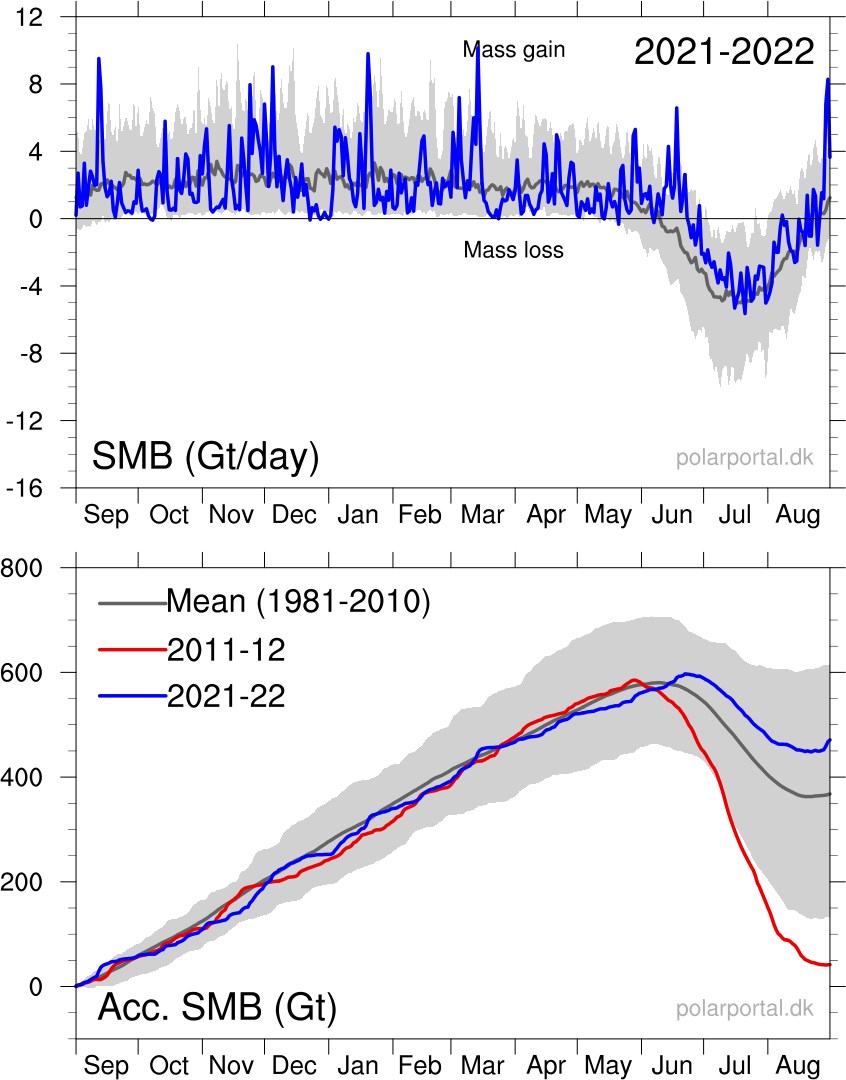
This excess of ice has been solely due to reduced summer melt. The melt season began about three weeks later than usual, and cold, cloudy weather for much of the summer kept melt below average.
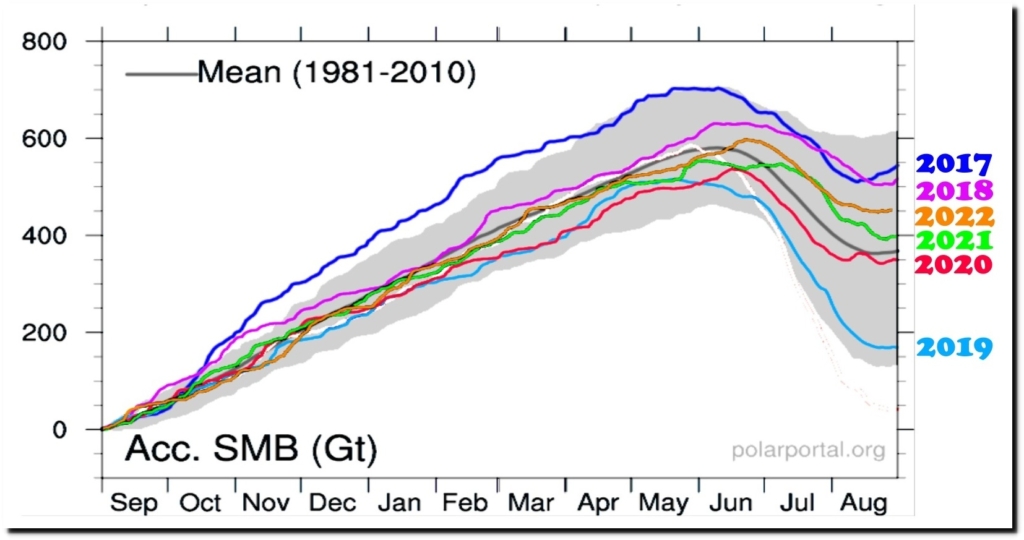
Four of the last six years have ended up with above average SMB.
https://realclimatescience.com/2022/08/more-than-twice-as-fake-as-the-previous-model/
As always, note that these calculations exclude glacial loss, which is measured separately by the DMI:


https://notalotofpeopleknowthat.wordpress.com/2021/06/12/greenland-temperatures-2021/
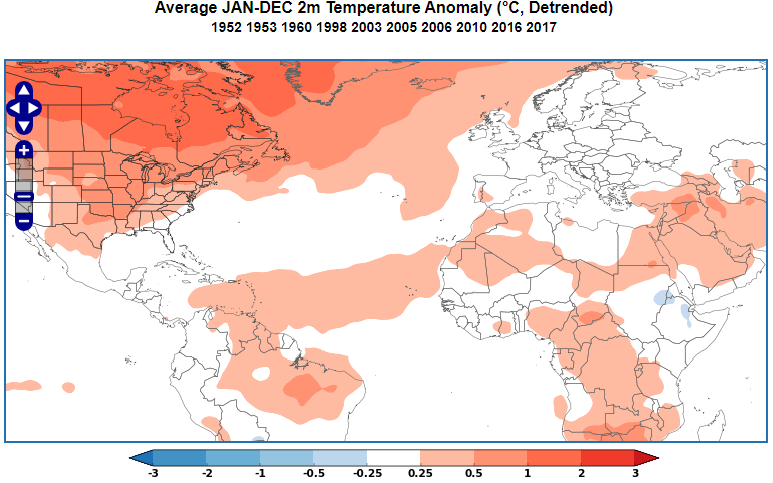
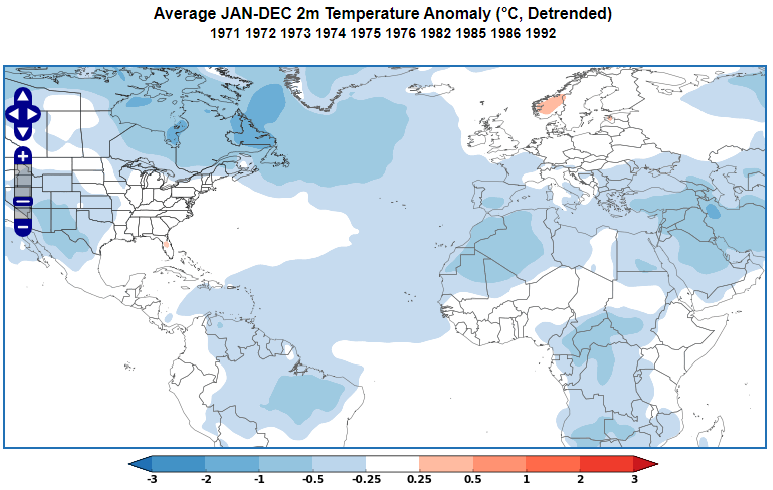
Greenland’s climate is heavily influenced by the Atlantic Multidecadal Oscillation, AMO. Temperatures in the last two decades are similar to those of the 1920s to 40s, and both periods correlate with the warm phase of the AMO. In between these periods occurred a much colder interlude, in turn coinciding with the cold phase of the AMO:

https://psl.noaa.gov/data/climateindices/
The maps below show the contrast in temperatures between warm and cold phases: