10 fallacies about Arctic sea ice & polar bear survival: teachers & parents take note

polarbearscience

Summer sea ice loss is finally ramping up: first year is disappearing, as it has done every year since ice came to the Arctic millions of years ago. But critical misconceptions, fallacies, and disinformation abound regarding Arctic sea ice and polar bear survival. Ahead of Arctic Sea Ice Day (15 July), here are 10 fallacies that teachers and parents especially need to know about.

Polar_Bear_Summer_2 FINAL (2)

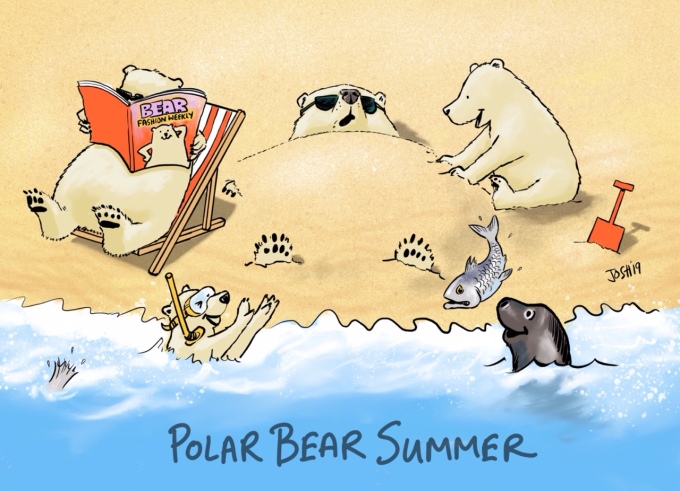
The cartoon above was done by Josh: you can drop off the price of a beer (or more) for his efforts here.

As always, please contact me if you would like to examine any of the references included in this post. These references are what make my efforts different from the activist organization Polar Bears International. PBI virtually never provide references within the content it provides, including material it presents as ‘educational’. Links to previous posts of mine that provide expanded explanations, images, and…

View original post 3,839 more words

Historic hot spells in Churchill, Polar Bear Capital of the World, in late June/early July

polarbearscience

Amid reports of a late June heat wave in Europe this year, I thought I would check out the temperature in Churchill, Manitoba – where sea ice off the coast has been rather slow to melt this year with no reports yet of polar bears onshore. It turns out that Churchill has fairly often seen very hot weather (around 90F/30C) for a few days at this time of year but 2019 has certainly not been one of them. Temperatures in Churchill on 28 June this year were about 40 degress F below previous highs (more than 15 degrees C) according to online Environment Canada weather comparison reports that go back to 1943 (although their records for Churchill go back to 1929).

Polar bear on ice_SARA registry webpage_gov CanHigh for 28 June 2019: 44.4 F/7.1 C

Hottest year, late June: 90.0 F/32.2 C on 29 June 1984 [also 87.8 F/30.6 C on 26 June…

View original post 550 more words

Mid June Arctic Ice Lopsided

Science Matters

In the first half of June 2019, the shift from ice to water is unusually lop-sided in two respects. The image above, supported by the table later on shows that in the last two weeks water has opened up faster on the Pacific side, and much slower on the Atlantic side, with the exception of Baffin Bay. The other surprise is that MASIE shows much less ice than does SII, a reversal of the typical situation.

The graph below shows the surprising discrepancy between MASIE and SII appearing in May and continuing in June.

Note that the NH ice extent 12 year average declined from 12.7M km2 to 10.9M km2 during in the last 30 days. MASIE 2019 shows about the same decline from 11.9M km2 to 10.3M km2. That track matched 2016 in May, but is now closest to 2010 and below other years. Interestingly SII showed a much…

View original post 222 more words

Activists who use polar bears as a symbol of climate change are out of touch with reality

polarbearscience

Young activists like Ollie Nancarrow from the UK need to find another symbol for their messages of climate change. Polar bears are thriving despite recent dramatic declines in summer sea ice: they have not been devastated as predicted by declining summer sea ice blamed on climate change. Anyone who uses a polar bear image to further a message of climate change, as Ollie has done, is simply out of touch with reality.

Standing bear_shutterstock_751891378_cropped web sizedHere are the facts, references provided.

In September 2007, Arctic sea ice hit a low never before seen since 1979 and panic set in about the future of polar bears. Biologists from the US Geological Survey had just insisted that when sea ice declined 42% below 1979 levels, which was expected at mid-century, 2/3 of the world’s polar bears would be gone (Amstrup et al. 2007; USGS 2007) – a drop from about 24,500 to only 8,100.

View original post 749 more words

Polar bear habitat update: open water primarily due to winds pushing pack ice

polarbearscience

Here is a look at what polar bear habitat looks like this year at the end of May compared to previous years. It helps put any predictions of impending doom into perspective.

Polar_bear Bering Sea 2007 USFWS lg

This is the time year when declining sea ice gets some people all worked up. However, declining ice is normal at this time of year and there is always variation in where the most open water appears first. At this time of year, there isn’t much ice ‘melt’ going on. Rather, what we are seeing is the opening up of shore leads and polynyas by winds.

Sea ice in Canada at 31 May

This year, as usual, open water increases with the expansion of persistent polynyas due to winds and currents. These areas increase the extent of ice edges and provide polar bears with more hunting habitat (because seals congregate near open water). This year, there is…

View original post 148 more words

Photographer’s claims that Inuit hunting is unsustainable are not supported

polarbearscience

A campaign by an anti-hunting Norwegian photographer to destroy the market for legally-hunted polar bears in Canada makes a few disturbingly false claims and an article at National Geographic in which he is quoted further distorts the picture of polar bear conservation. I understand that some people object to hunting and wish more people felt like they do – but this sort of argument is unlikely to sway any but the most gullible.

Cover photo Ole J Liodden small web

Norwegian photographer Ole Liodden apparently has a master’s degree in “nature management and environmental policy“. He takes fabulous polar bear pictures (I purchased one of them, above, for the cover of my novel, EATEN) but his crusade to ban hunting and trade in polar bear products world-wide has lead him to misrepresent essential facts, which is no way to win an argument. A National Geographic writer and several polar bear specialists have provided additional…

View original post 1,000 more words

Arctic Sea Ice Volume 20190526

DMI has stopped producing their Ice Volume Charts. 

[Edit:  DMI has embedded their Ice Volume charts in the Thickness Chart, here:

https://i0.wp.com/ocean.dmi.dk/arctic/icethickness/images/FullSize_CICE_combine_thick_SM_EN_20190526.pngHere’s the link to the DMI charts (click here):

So here’s the PIOMAS product.

BPIOMASIceVolumeAnomaly20190526

A linear trend fit onto a naturally cyclical physical system is ridiculous.

So, here’s a crude hand-drawn curve to their product.  Different perspective.

BPIOMASIceVolumeAnomaly20190526 with sine curve

Be wary of linear trend lines.